Thinking about making a move? Let’s talk real estate! Whether you're buying or selling, I’ve got the tips and expertise to guide you every step of the way. Reach out today, and let’s find your perfect home! 🏡 brandonfrancisrealestate@gmail.com
You’ll find our blog to be a wealth of information, covering everything from local market statistics and home values to community happenings. That’s because we care about the community and want to help you find your place in it. Please reach out if you have any questions at all. We’d love to talk with you!
Thinking about making a move? Let’s talk real estate! Whether you're buying or selling, I’ve got the tips and expertise to guide you every step of the way. Reach out today, and let’s find your perfect home! 🏡 brandonfrancisrealestate@gmail.com
💭🏡 Curious about how much home is within reach? Let’s dive into the numbers and find the perfect fit for you! From cozy starter homes to dream upgrades, I’m here to help you every step of the way. Ready to get started? Drop me a message!
Brandon Francis
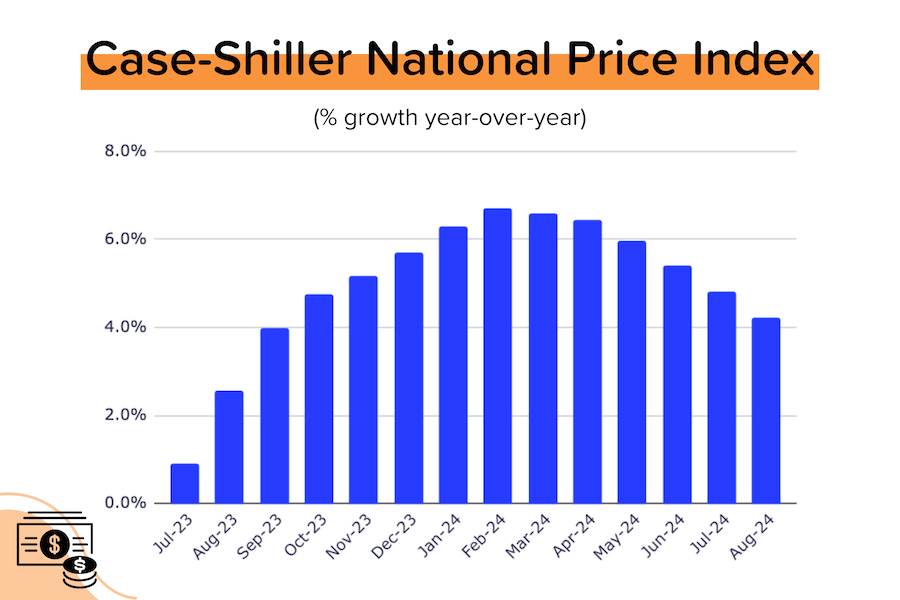
The Case-Shiller national home price index for August was up +4.2% year-over-year - still solid, but a big deceleration from +6.7% YoY back in February. With 30-yr mortgage rates rebounding above 7% and inventory continuing to rise, price growth should moderate further. Data provider CoreLogic forecasts just 2.3% price growth over the next 12 months. [Source: S&P DJI, CoreLogic]
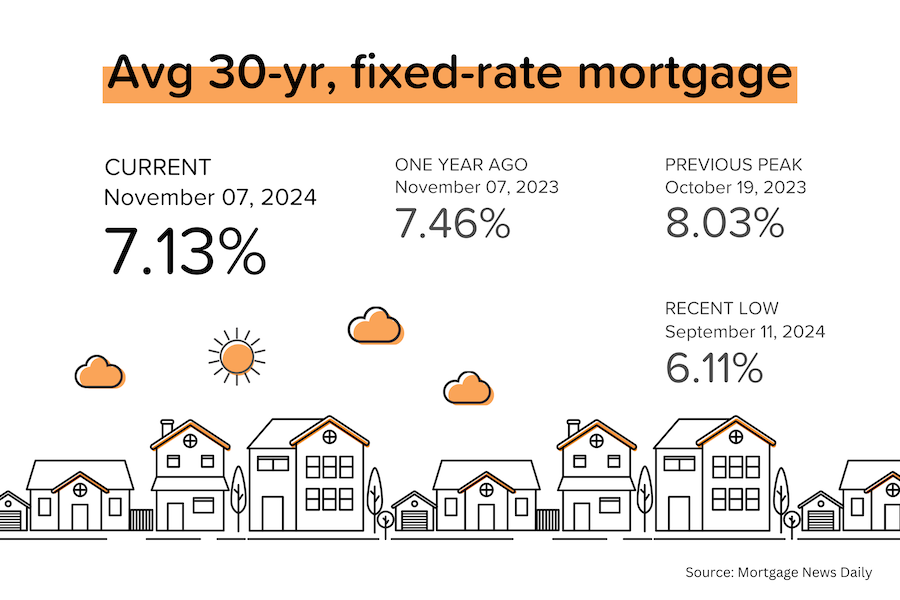
Trump's victory in the presidential election boosted stock prices on Wednesday but hit bonds hard. As a result, the yield on the 10-year US treasury jumped near 4.5% and average 30-yr mortgage rates moved above 7.1% for the first time since July 2024. [Source: MBS Highway, Mortgage News Daily]
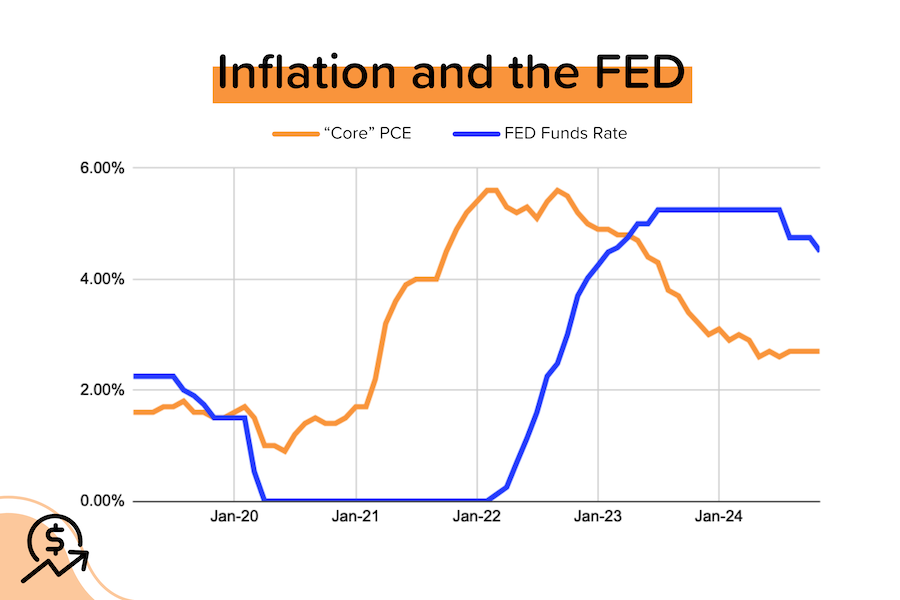
Despite recent contradictory data regarding the strength of the economy, Fed members stuck to the loosening program and voted to reduce the target Federal Funds Rate by 25 basis points (one quarter of a percentage point) on Thursday. That said, with inflation (as measured by "core" PCE) down dramatically in the last 2 years, The Fed still has a lot of "catching down" to do. [Source: Federal Reserve]
Brandon Francis
Here you can enhance your area’s housing market data with your own insights and commentary!
| Area | Median Price | Active Listings | New Listings - 5 days | Median Days on Market |
|---|---|---|---|---|
| South Jordan, UT |
$639,945

-0.3%
|
284

2.9%
|
19 |
51

0%
|
| Riverton, UT |
$599,900
-0.2%
|
179
-0.5%
|
9 |
66
0.1%
|
| Draper, UT |
$995,000
0%
|
101
-0.2%
|
5 |
62
0.1%
|
| Herriman, UT |
$649,900
0%
|
215
-0.3%
|
11 |
66
-0.1%
|
/) from Oct. to Nov. 2024..png)


Curious about local real estate? So are we! Every month we review trends in our real estate market and consider the number of homes on the market in each price tier, the amount of time particular homes have been listed for sale, specific neighborhood trends, the median price and square footage of each home sold and so much more. We’d love to invite you to do the same!
You can sign up here to receive your own market report, delivered as often as you like! It contains current information on pending, active and just sold properties so you can see actual homes in your neighborhood. You can review your area on a larger scale, as well, by refining your search to include properties across the city or county. As you notice price and size trends, please contact us for clarification or to have any questions answered.
We can definitely fill you in on details that are not listed on the report and help you determine the best home for you. If you are wondering if now is the time to sell, please try out our INSTANT home value tool. You’ll get an estimate on the value of your property in today’s market. Either way, we hope to hear from you soon as you get to know our neighborhoods and local real estate market better.